Data Visualization
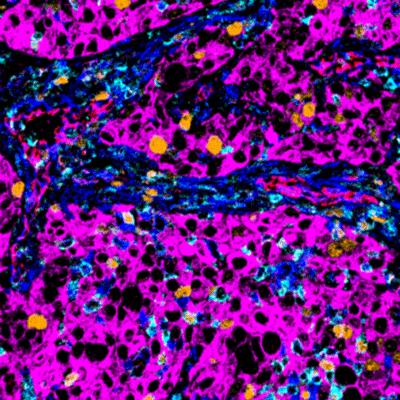
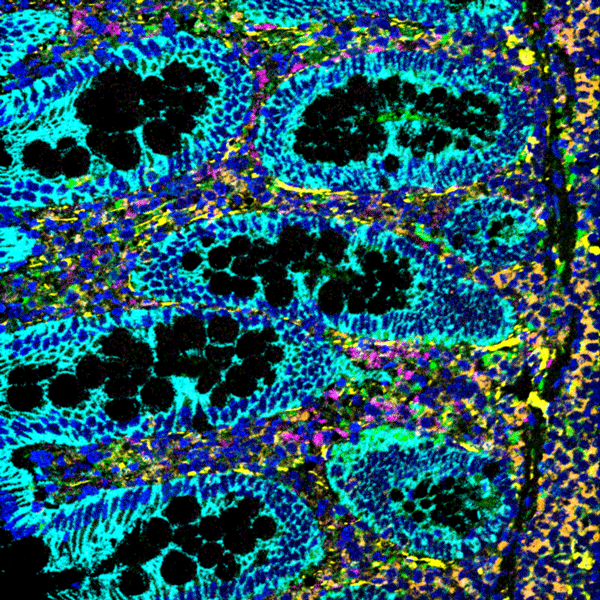
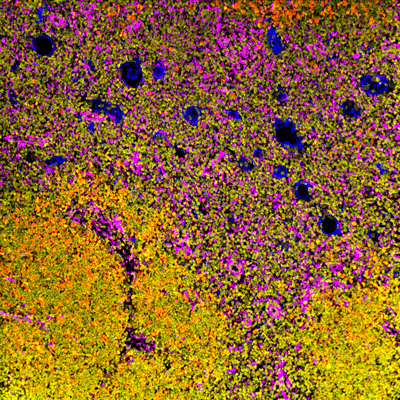
MIBItracker Software’s unique, cloud-based repository lets you easily review slide and image data, and it’s easily accessible through a web browser. You can customize the display for each image or image set including selecting channels for overlay, setting channel relative intensity, pixel smoothing, and channel pseudo-color. Images can also be exported as raw grayscale multi-layer TIFF files for subsequent analysis in third-party packages such as Fiji, HALO®, VisioPharm® and QuPath. Our MIBItracker API lets you easily integrate the software into your analysis workflows.
MIBItracker Demo
Use our MIBItracker demo to view sample images as well as images from various published studies where MIBI-enabled imaging and MIBI high-defintion spatial proteomics were used for the single-cell, spatial, and quantitative analysis of tissue microenvironments.
Using the interactive demo, you can select targets of interest, assign desired colors to different marker channels, and use the sliders to customize the visualization.


